


MapSherpa Catalog
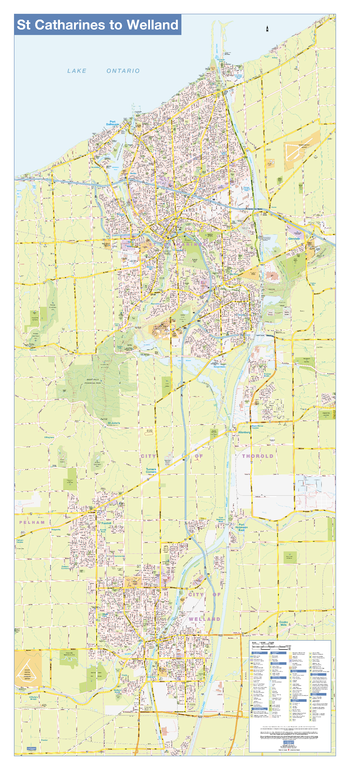
St Catharines/Welland Wall Map - Street Detail
Lucidmap
This wall map shows highly detailed local information for the city of St Catharines/Welland. Full street labeling along with transit information, parks, schools, churches and landmarks throughout the city are displayed.
The map has been designed in a very clear and legible manner with a traditional Canadian street map style embraced by map buyers over many years.
Page Size: 24 x 54 in (610 x 1372 mm)
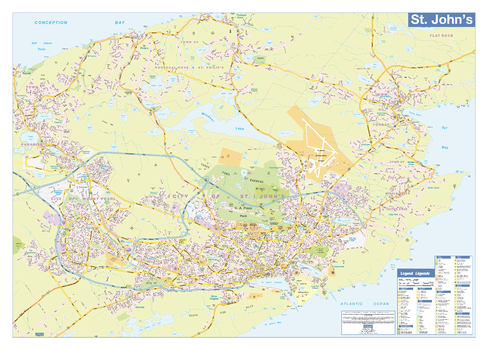
St John's Wall Map - Street Detail
Lucidmap
This wall map shows highly detailed local information for the city of St John's. Full street labeling along with transit information, parks, schools, churches and landmarks throughout the city are displayed.
The map has been designed in a very clear and legible manner with a traditional Canadian street map style embraced by map buyers over many years.
Page Size: 38 x 27 in (965 x 686 mm)
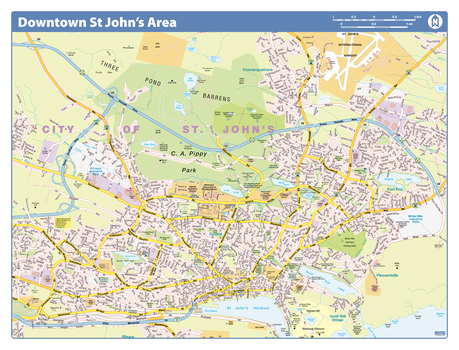
St. John's Downtown - Compact
Lucidmap
Map of downtown St. John's showing all roads, road names, political boundaries, transit, points of interest, parks, schools, churches, public buildings and landmarks.
Page Size: 21.5 x 16.25 in (546 x 413 mm)

St. Lawrence and Great Lakes Sailing (1906)
Natural Resources Canada
Contained within the 1st Edition (1906) of the Atlas of Canada is a map that shows canals, as well as locations and types of Lighthouses along the St. Lawrence and Great Lakes. In addition, the map also shows sailing routes through those water bodies. There is a table of sailing distances, in geographical miles, between the ports of the United States and Canada on the Great Lakes and St. Lawrence. Statistics of freight and passenger traffic through the canals, total cost of maintenance, and the construction of Canadian canals, are shown as of 1903-1904. There are also steamship routes from Canadian ports to other ports in Canada and in the U.S. The lighthouses are distinguished between fixed, revolving lights, and light ships. The depth of the water of the Great Lakes is indicated by contours and tints of blue. The deeper portions are shown in the darker tints, while lighter tints indicate more shallow waters.
Page Size: 24.25 x 17.25 in (612 x 433 mm)
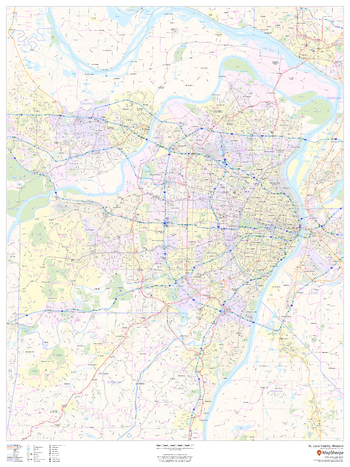
St. Louis County, Missouri
MapSherpa
This map of St. Louis County, Missouri shows regional level information. Base map features include highways and major roads with labelling; neighborhood names; railways; high level land use such as parks and recreation areas, industrial areas and hospital campuses; and a selection of points of interest including transportation hubs like airports and train stations, tourist information, police stations and shopping centres. ZIP code boundaries are shown as a secondary map feature.
Page Size: 36 x 48 in (914 x 1219 mm)
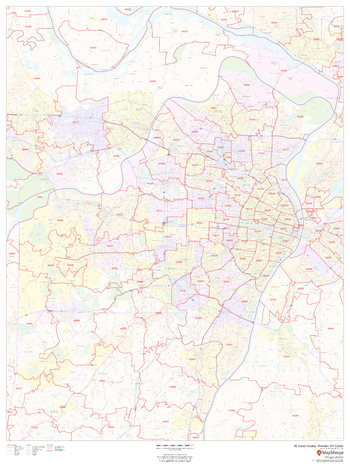
St. Louis County, Missouri ZIP Codes
MapSherpa
This map of St. Louis County, Missouri shows ZIP code areas overlaid on a road map. Ideal for planning of deliveries, home services, sales territories, real estate and much more. Base map features include all roads with major roads and highways labelled; neighborhood names; railways; and high level land use such as parks and recreation areas, industrial areas and hospital campuses.
Page Size: 36 x 48 in (914 x 1219 mm)
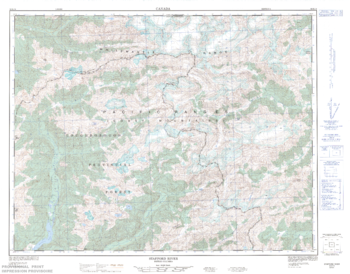
Stafford River - 92 K/14 - British Columbia
Natural Resources Canada
Canadian topographic map of Stafford River, British Columbia. NTS sheet 092K14 Edition 1.
Page Size: 32.75 x 25.75 in (828 x 649 mm)
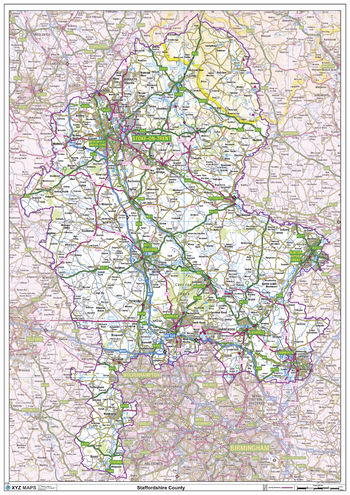
Staffordshire County Map
XYZ Maps
This is a large ceremonial county map of Staffordshire highlighting the county border, with the surrounding area faded out for excellent contrast. The map covers Burslem, Burton upon Trent, Hanley, Leek, Lichfield, Stoke-on-Trent, Stafford, Uttoxeter, Walsall, West Bromwich and Wolverhampton. The county map shows the latest County and Unitary Authority Boundaries, Overlaid on a Clear and Easy to Read Ordnance Survey map.
Page Size: 33.25 x 47 in (841 x 1189 mm)
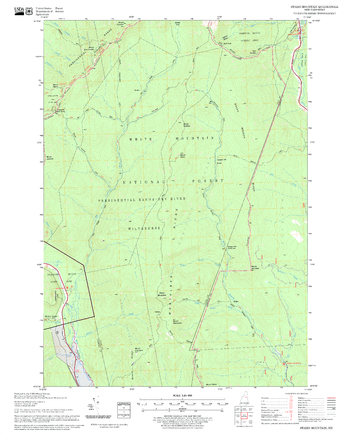
Stairs Mountain Quadrangle, New Hampshire-Vermont
United States Forest Service
United States Forestry Service topographical map of Stairs Mountain, New Hampshire-Vermont
Page Size: 21.75 x 27 in (552 x 686 mm)

Stanford's Africa Map (1879)
Stanfords
Reproduction of a very interesting map of Africa published by our founder Edward Stanford in 1879 and showing the continent in the relatively early stages of its colonization. The information marked on the map forms a fascinating mixture of names of towns, countries or colonial possessions, geographical regions or features such as deserts, and of many African tribes. Although the map has no physical colouring, it instantly conveys much information about the continent's geography through the distribution of the already explored regions with established administrative entities. The bulk of the coastline is already in colour and various political units are shown in the more accessible Sahel belt, from the Atlantic along the Niger and around Lake Chad to Darfur and northern Ethiopia. However, the Sahara and the great expanse of the continent around the Congo (called here Livingstone River) and further south and east are yet to be colonized. Although, in many places, particularly in East Africa, various geographical features are already marked on the map. Latitude and longitude lines are drawn at 10° intervals. Of all the continents, Africa has undergone most changes from the mid 19th century to the present day and this map provides an early step towards understanding its history.
Page Size: 12.75 x 17 in (319 x 430 mm)

Stanford's Chart of the Solent, Spithead and Southampton Water (1932)
Stanfords
The Stanford's Chart of The Solent, Spithead and Southampton Water is from a fascinating series of reproductions from our Edward Stanford Cartographic Collection archive. Published in 1932, prepared under the supervision of Captain O.M.Watts, A.I.N.A. This map shows the entire Isle of Wight and the surrounding coast line from Selsey to Milford on Sea with inset charts of Beaulieu River, Bembridge, Cowes, Hamble River, River Itchen, Keyhaven, Lymington River, Newtown River, Wootton Creek and Yarmouth. This chart contains lots of tidal information and explanations. Soundings are given at low water ordinary spring tides in fathoms upon the general chart, and in feet upon the inserts. Based upon British Admiralty Charts with the permission of the controller of H.M. Stationary Office and of the Hydrographer of the Navy. This beautifully detailed map will be appeal to anyone with nautical interests.
Page Size: 26.25 x 40.25 in (666 x 1016 mm)

Stanford's Eastern Hemisphere Map (1877)
Stanfords
The Stanford's Map of The Eastern Hemisphere is from a fascinating series of reproductions from our Edward Stanford Cartographic Collection archive. The original map from 1877 was drawn by Stanford's Geographical Establishment and "published under the direction of the Committee of General Literature and Education Appointed by The Society for Promoting Christian Knowledge and of the National Society". Individual countries are presented in gentle pastel hues, typical of hand-coloured maps, with their borders outlined in stronger colours. The publication date of 1877 gives us a Europe of large imperial states, much of Asia is as we know it, but Africa is still in the early stages of colonization with its interior largely unexplored. Hachures are used to show the mountain ranges and many other features of contemporary cartography are included: ocean currents and trade winds, surrounding frames showing the tropical zones and the position of the sun, etc. Latitude and longitude lines are drawn at 10° intervals. Additional panels on this map of the Eastern Hemisphere give the continents as viewed from the two poles. At the bottom there is a comparative series of vertical cross-sections showing the principle elevations of each continent on their respective parallels of latitude. They are also as sections showing them as they stand in relation to each other in their distances from the central meridian.
Page Size: 52.25 x 61.5 in (1326 x 1558 mm)

Stanford's Eastern Hemisphere Map (1877) - Resized to 2A0 width
Stanfords
Resized so that the short side is equivalent to 2A0 short side. The Stanford's Map of The Eastern Hemisphere is from a fascinating series of reproductions from our Edward Stanford Cartographic Collection archive. The original map from 1877 was drawn by Stanford's Geographical Establishment and "published under the direction of the Committee of General Literature and Education Appointed by The Society for Promoting Christian Knowledge and of the National Society". Individual countries are presented in gentle pastel hues, typical of hand-coloured maps, with their borders outlined in stronger colours. The publication date of 1877 gives us a Europe of large imperial states, much of Asia is as we know it, but Africa is still in the early stages of colonization with its interior largely unexplored. Hachures are used to show the mountain ranges and many other features of contemporary cartography are included: ocean currents and trade winds, surrounding frames showing the tropical zones and the position of the sun, etc. Latitude and longitude lines are drawn at 10° intervals. Additional panels on this map of the Eastern Hemisphere give the continents as viewed from the two poles. At the bottom there is a comparative series of vertical cross-sections showing the principle elevations of each continent on their respective parallels of latitude. They are also as sections showing them as they stand in relation to each other in their distances from the central meridian.
Page Size: 47 x 55 in (1189 x 1397 mm)

Stanford's Eastern and Western Hemispheres Map (1877)
Stanfords
The Stanford's Map of The Western and Eastern Hemispheres is from a fascinating series of reproductions from our Edward Stanford Cartographic Collection archive. The original map from 1877 was drawn by Stanford's Geographical Establishment and "published under the direction of the Committee of General Literature and Education Appointed by The Society for Promoting Christian Knowledge and of the National Society". Individual countries are presented in gentle pastel hues, typical of hand-coloured maps, with their borders outlined in stronger colours. The publication date of 1877 gives us the Americas more or less as we know it now but Antarctica with only a handful of coastal places named and believed to be flat. On the eastern side we see a Europe of large imperial states, much of Asia is as we know it, but Africa is still in the early stages of colonization with its interior largely unexplored. The stereographic projection, individual countries are presented in gentle pastel hues typical of hand-coloured maps, with their borders outlined in stronger colours. Latitude and longitude lines are drawn at 10° intervals. Hachures are used to show the mountain ranges and many other features of contemporary cartography are included: ocean currents and trade winds, surrounding frames showing the tropical zones and the position of the sun, etc. Additional panels on the side of the Western Hemisphere give examples of six different map projections, including Mercator's projection and the gores of a globe complete on the same scale at the equator. On the side of the Eastern Hemisphere you can see additional panels of the continents as viewed from the two poles as well as a comparative series of vertical cross-sections showing the principle elevations of each continent on their respective parallels of latitude.
Page Size: 58 x 98.5 in (1470 x 2500 mm)

Stanford's Eastern and Western Hemispheres Map (1877) - Resized to 2A0 height
Stanfords
Resized so that the short side is equivalent to 2A0 short side. The Stanford's Map of The Western and Eastern Hemispheres is from a fascinating series of reproductions from our Edward Stanford Cartographic Collection archive. The original map from 1877 was drawn by Stanford's Geographical Establishment and "published under the direction of the Committee of General Literature and Education Appointed by The Society for Promoting Christian Knowledge and of the National Society". Individual countries are presented in gentle pastel hues, typical of hand-coloured maps, with their borders outlined in stronger colours. The publication date of 1877 gives us the Americas more or less as we know it now but Antarctica with only a handful of coastal places named and believed to be flat. On the eastern side we see a Europe of large imperial states, much of Asia is as we know it, but Africa is still in the early stages of colonization with its interior largely unexplored. The stereographic projection, individual countries are presented in gentle pastel hues typical of hand-coloured maps, with their borders outlined in stronger colours. Latitude and longitude lines are drawn at 10° intervals. Hachures are used to show the mountain ranges and many other features of contemporary cartography are included: ocean currents and trade winds, surrounding frames showing the tropical zones and the position of the sun, etc. Additional panels on the side of the Western Hemisphere give examples of six different map projections, including Mercator's projection and the gores of a globe complete on the same scale at the equator. On the side of the Eastern Hemisphere you can see additional panels of the continents as viewed from the two poles as well as a comparative series of vertical cross-sections showing the principle elevations of each continent on their respective parallels of latitude.
Page Size: 47 x 79.75 in (1189 x 2022 mm)

Stanford's Facsimile of the Hereford Mappa Mundi (1869)
Stanfords
The Stanford's Facsimile of the Hereford Mappa Mundi is from a fascinating series of reproductions from our Edward Stanford Cartographic Collection archive.
Page Size: 55.75 x 65.75 in (1410 x 1664 mm)

Stanford's Facsimile of the Hereford Mappa Mundi (1869) - Resized to 2A0 width
Stanfords
Resized so that the short side is equivalent to 2A0 short side. The Stanford's Facsimile of the Hereford Mappa Mundi is from a fascinating series of reproductions from our Edward Stanford Cartographic Collection archive.
Page Size: 47 x 55.25 in (1189 x 1403 mm)

Stanford's Folio Asia Map, by J. Arrowsmith (1884)
Stanfords
The Stanford's Asia Map is from a fascinating series of reproductions from our Edward Stanford Cartographic Collection archive. This map was made by the famous cartographer John Arrowsmith and published by Stanfords in 1884. Country boundaries are outlined in bright colours while the pale background with subtle hachure to show the mountain ranges makes the numerous place names easy to read. Many smaller tributaries of the continent's great rivers are named, from the Ob, the Yenisei and the Lena in the north to the Ganges or the Irrawaddy in the south and the Yangtze in the east. Coverage extends to the Equator, so the southern part of Indonesia is not included. While the north of the continent looks as it was 100 years later except for the changes in the European part of Russia, Central Asia and the Middle East are much different from now, Mongolia is still part of China, etc. Names of Chinese ports open to foreign commerce after the Second Opium War are underlined; "Hong-kong I. & Victoria" are duly annotated with Cy for colony. Latitude and longitude lines are drawn at 5° intervals.
Page Size: 21.5 x 29.25 in (543 x 741 mm)

Stanford's Folio British Isles Map (1884)
Stanfords
The Stanford's British Isles Map is from a fascinating series of reproductions from our Edward Stanford Cartographic Collection archive. Published in 1884, this map shows the British Isles with their old historic counties. Bright colours highlight the boundaries of the old counties as they were. The pale background makes all the place names easy to read. In common with other maps published by Stanfords at that time, an unusually large number of small rivers are named, even the lovely Cuckmere is there. Ironically perhaps, the map provides an interesting contrast between the significant administrative changes within Great Britain and the retention of the county borders within Ireland. This map includes lots more interesting historical finds, for example; London looks significantly smaller than it does on maps today mostly falling within the county of Middlesex. This is a great map that beautifully tells this history of counties.
Page Size: 21.75 x 29.5 in (547 x 745 mm)

Stanford's Folio Europe Map, by J. Arrowsmith (1884)
Stanfords
The Stanford's Europe Map is from a fascinating series of reproductions from our Edward Stanford Cartographic Collection archive. This map was made by the famous cartographer John Arrowsmith and published by Stanfords in 1884. The map presents the continent at the height of its great empires: imperial Russia with Finland and much of Poland, united Germany including Alsace and part of Lorraine, the Austro-Hungarian Empire (although already post the Compromise, still shown here as one country) with north-western Balkans, and the Ottomans still with Albania and much of the present-day Greece. Country boundaries are outlined in bright colours while the pale background with subtle hachuring indicating the mountain ranges are in most places printed very faintly so names of towns and numerous geographical region marked on the map are easy to read. The map also has an unusually large number of names of smaller rivers. Latitude and longitude lines are drawn at 5° intervals.
Page Size: 21.75 x 29.5 in (546 x 745 mm)
No search results