


MapSherpa Catalog

Stanford's Folio Japan Map (1884)
Stanfords
The Stanford's Folio Japan Map is from a fascinating series of reproductions from our Edward Stanford Cartographic Collection archive.
Page Size: 21.5 x 29.25 in (540 x 740 mm)

Stanford's Folio North America Map (1884)
Stanfords
The Stanford's Map of North America is from a fascinating series of reproductions from our Edward Stanford Cartographic Collection archive. Originally published in 1884, this map features bright colours highlighting international borders, with corresponding colouring indicating state/provincial borders within USA, Canada and Mexico. Plain background with hachure for mountain ranges makes the place names marked on the map easy to read. Several mountain peaks, mainly in USA, are shown with heights (in feet). In common with other map published by Stanfords around that time, numerous smaller rivers are named. Latitude and longitude lines are drawn at 5° intervals. Whilst at the first glance there have been few significant changes in the international boundaries. Panama is still shown as part of Colombia plus Greenland and Iceland are in Danish colours, internal administrative border provide much interesting detail. In the US all the states which acceded to the Union after the map's publication date are already there, but with the Dakotas as one state and Oklahoma shown as the Indian Territory and its panhandle as separate Public Lands. In Canada, the northern borders of most of the provinces are much further south than today, southern Saskatchewan called Assiniboia and northern Alberta as Athabasca, etc. Coverage of Canada extends north to the Parry Islands (now Queen Elizabeth Islands), with only the south-eastern coast of the Ellesmere Island. In the Caribbean individual islands are in the colours of their colonial powers (their names are not marked on the map). Another interesting feature are the markings for the submarine telegraph cables.
Page Size: 21.5 x 29 in (545 x 737 mm)

Stanford's Folio Smaller Railway Map of the United States (1876)
Stanfords
The Stanford's Folio Smaller Railway Map of the United States is from a fascinating series of reproductions from our Edward Stanford Cartographic Collection archive.
Page Size: 22 x 29.75 in (555 x 750 mm)

Stanford's General Map of the World (1920)
Stanfords
The Stanford's General Map of the World Map is from a fascinating series of reproductions from our Edward Stanford Cartographic Collection archive. This map from 1920 reflects the changes in political boundaries and the new world order in the aftermath of World War I. The colouring and annotations to place names not only indicate dominions and colonial possessions, with the British Empire in its customary red, but also show territories administered under the Mandate of the League of Nations. On land masses topographic information is provided by names of mountain ranges and of an unusually large number of rivers. Main railway routes are also marked. On seas and oceans, principal shipping routes are shown annotated with distances. The map has latitude and longitude lines at 15 degree intervals and for each longitude line indicates the time difference with the Greenwich Meridian. The map is drawn on a Mercator's projection.
Page Size: 18.75 x 28 in (474 x 709 mm)

Stanford's General Map of the World (1920) Blue Version
Stanfords
The Stanford's General Map of the World Blue Version is from a fascinating series of reproductions from our Edward Stanford Cartographic Collection archive.
Page Size: 31.5 x 47.25 in (800 x 1200 mm)

Stanford's General Map of the World on Mercator's Projection (1922)
Stanfords
The Stanford's General Map of the World on Mercator's Projection is from a fascinating series of reproductions from our Edward Stanford Cartographic Collection archive.
Page Size: 27.25 x 41.5 in (687 x 1048 mm)
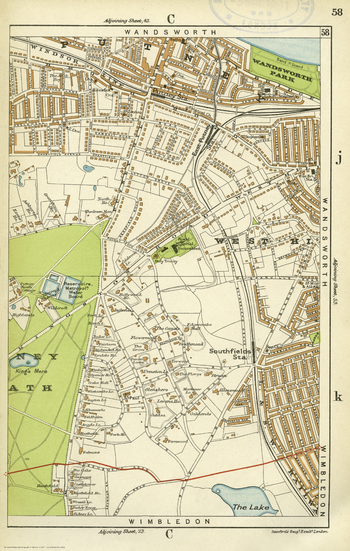
Stanford's Indexed Atlas of the County of London, Sheet 58, Putney & Southfields (1911)
Stanfords
The Stanford's Indexed Atlas of the County of London Sheet 58 is from a fascinating series of reproductions from our Edward Stanford Cartographic Collection archive.
Page Size: 15.75 x 24.75 in (396 x 623 mm)

Stanford's Library Map of Africa (1890)
Stanfords
The Stanford's Library Map of Africa is from a fascinating series of reproductions from our Edward Stanford Cartographic Collection archive.
Page Size: 35.5 x 39.5 in (900 x 1000 mm)

Stanford's Library Map of London Sheet 1 Black and White (1862)
Stanfords
The Stanford's Library Map of London (Sheet 1) is from a fascinating series of reproductions from our Edward Stanford Cartographic Collection archive.
Page Size: 14.75 x 17.75 in (371 x 450 mm)

Stanford's Library Map of London Sheet 10 Black and White (1862)
Stanfords
This map covering Victorian London during a period of rapid expansion and improvement is from a fascinating series of reproductions from our Edward Stanford Cartographic Collection archive. Stanford's Library Map is one of the great maps of London. It shows the city at a key time of the development of the metropolis and the impact of the railway. Our founder, Edward Stanford took the Ordnance Survey 12 inch to a mile sheets of their Skeleton Survey (showing outline and elevation only) for the Metropolitan Commissioners of Sewers, and despatched his own surveyors to complete immense quantity of detail for which this map is notable. Originally at a scale of 1:10560 a 14x16"map in a series of 24 which included surrounding areas. This map is in black and white and is extremely detailed, naming streets and marking major buildings. The map coverage is of central London and extends out to Marylebone and Knightsbridge to the west showing some of Hyde Park. The northern point includes Bloomsbury and the British Museum. It extends down to Victoria Station and Lambeth Bridge and shows a small portion of Lambeth and Waterloo south of the river. This lovely map will appeal to anyone interested in this great city.
Page Size: 14.75 x 17.75 in (370 x 450 mm)
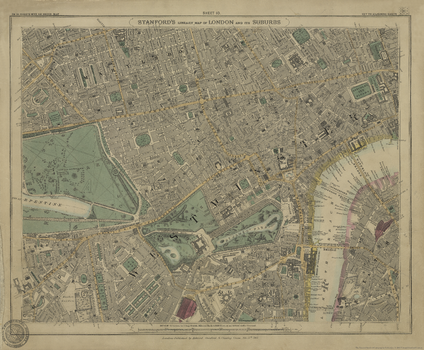
Stanford's Library Map of London Sheet 10 Colour (1862)
Stanfords
This map covering Victorian London during a period of rapid expansion and improvement is from a fascinating series of reproductions from our Edward Stanford Cartographic Collection archive. Stanford's Library Map is one of the great maps of London. It shows the city at a key time of the development of the metropolis and the impact of the railway. Our founder, Edward Stanford took the Ordnance Survey 12 inch to a mile sheets of their Skeleton Survey (showing outline and elevation only) for the Metropolitan Commissioners of Sewers, and despatched his own surveyors to complete immense quantity of detail for which this map is notable. Originally at a scale of 1:10560 a 14x16"map in a series of 24 which included surrounding areas. This map is extremely detailed, naming streets and marking major buildings. It has been subtly coloured so that green areas, water and main roads and water are distinguished. The map coverage is of central London and extends out to Marylebone and Knightsbridge to the west showing some of Hyde Park. The northern point includes Bloomsbury and the British Museum. It extends down to Victoria Station and Lambeth Bridge and shows a small portion of Lambeth and Waterloo south of the river.
Page Size: 14.25 x 17.25 in (362 x 438 mm)
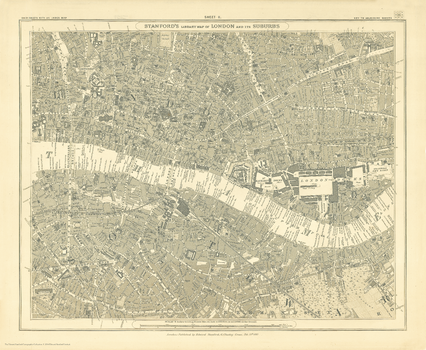
Stanford's Library Map of London Sheet 11 Black and White (1862)
Stanfords
The Stanford's Library Map of London (Sheet 11) is from a fascinating series of reproductions from our Edward Stanford Cartographic Collection archive.
Page Size: 14.75 x 17.75 in (370 x 450 mm)
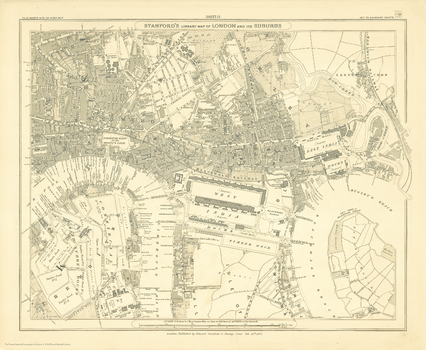
Stanford's Library Map of London Sheet 12 Black and White (1862)
Stanfords
The Stanford's Library Map of London (Sheet 12) is from a fascinating series of reproductions from our Edward Stanford Cartographic Collection archive.
Page Size: 14.75 x 17.75 in (370 x 450 mm)
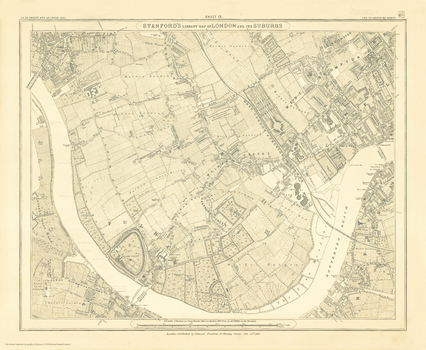
Stanford's Library Map of London Sheet 13 Black and White (1862)
Stanfords
The Stanford's Library Map of London (Sheet 13) is from a fascinating series of reproductions from our Edward Stanford Cartographic Collection archive.
Page Size: 14.75 x 17.75 in (370 x 450 mm)
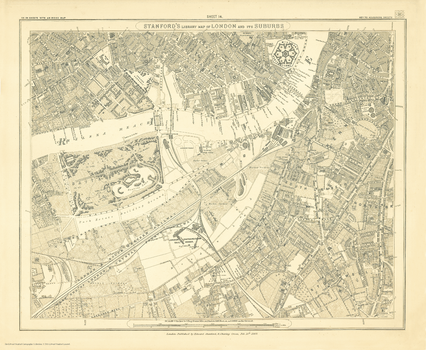
Stanford's Library Map of London Sheet 14 Black and White (1862)
Stanfords
The Stanford's Library Map of London (Sheet 14) is from a fascinating series of reproductions from our Edward Stanford Cartographic Collection archive.
Page Size: 14.75 x 17.75 in (370 x 450 mm)
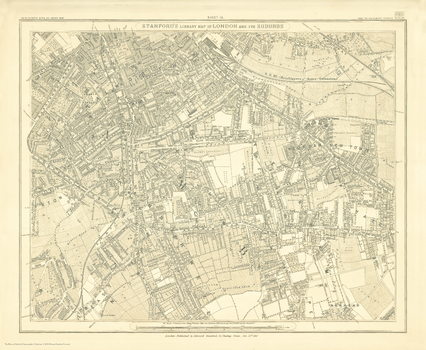
Stanford's Library Map of London Sheet 15 Black and White (1862)
Stanfords
The Stanford's Library Map of London (Sheet 15) is from a fascinating series of reproductions from our Edward Stanford Cartographic Collection archive.
Page Size: 14.75 x 17.75 in (370 x 450 mm)
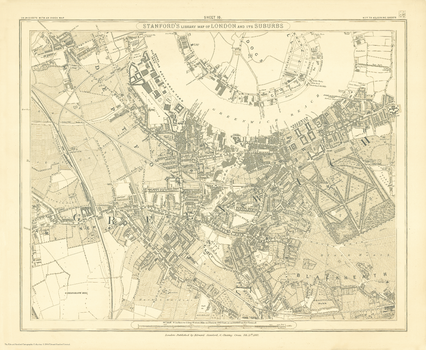
Stanford's Library Map of London Sheet 16 Black and White (1862)
Stanfords
The Stanford's Library Map of London (Sheet 16) is from a fascinating series of reproductions from our Edward Stanford Cartographic Collection archive.
Page Size: 14.75 x 17.75 in (370 x 450 mm)
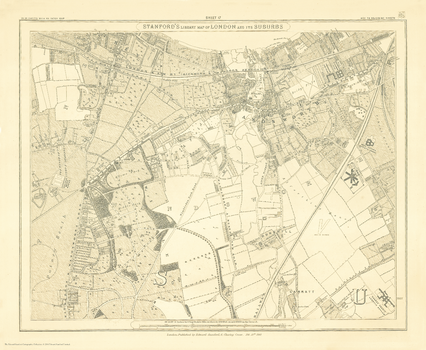
Stanford's Library Map of London Sheet 17 Black and White (1862)
Stanfords
The Stanford's Library Map of London (Sheet 17) is from a fascinating series of reproductions from our Edward Stanford Cartographic Collection archive.
Page Size: 14.75 x 17.75 in (370 x 450 mm)
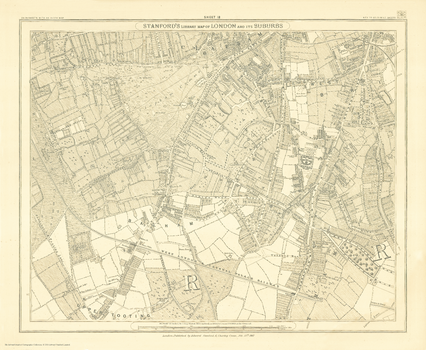
Stanford's Library Map of London Sheet 18 Black and White (1862)
Stanfords
The Stanford's Library Map of London (Sheet 18) is from a fascinating series of reproductions from our Edward Stanford Cartographic Collection archive.
Page Size: 14.75 x 17.75 in (370 x 450 mm)
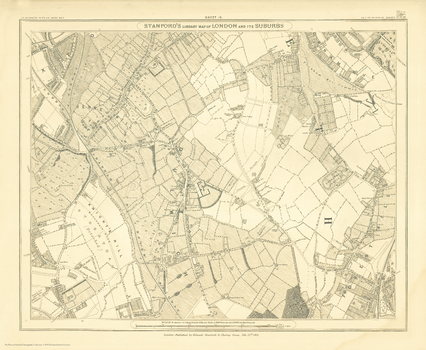
Stanford's Library Map of London Sheet 19 Black and White (1862)
Stanfords
The Stanford's Library Map of London (Sheet 19) is from a fascinating series of reproductions from our Edward Stanford Cartographic Collection archive.
Page Size: 14.75 x 17.75 in (370 x 450 mm)
No search results