Stanfords
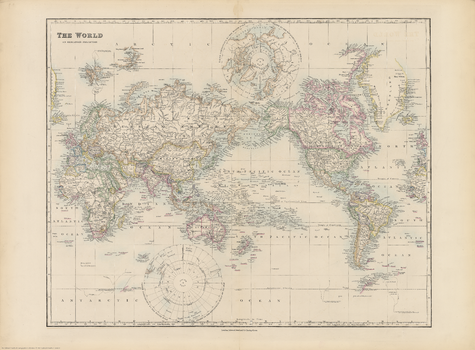
Stanford's Pacific-centred World Map (1884)
The Stanford’s Pacific-centred World Map is from a fascinating series of reproductions from our Edward Stanford Cartographic Collection archive. Originally published in 1884, this political wall map is drawn on a Mercator’s projection presenting the world with the Pacific Ocean at its centre. Political boundaries are coloured in bold, gradually shading lighter as is typical in maps from this time. Latitude and longitude lines are at 10° intervals. Europe and Africa look very different from today, Asia with many changes mainly in the Middle East, but the Americas mostly unchanged. A particularly interesting feature of the map is the difference in the presentation of the two Polar Regions: the Arctic Ocean with most of its coastline already there, whilst the Antarctic is still in the early stages of exploration and only segments of its coast already mapped. Separate panels show lands contiguous to the North and South Poles, drawn to the equatorial scale of the map.
Page Size: 21.75 x 29.25 in (546 x 741 mm)
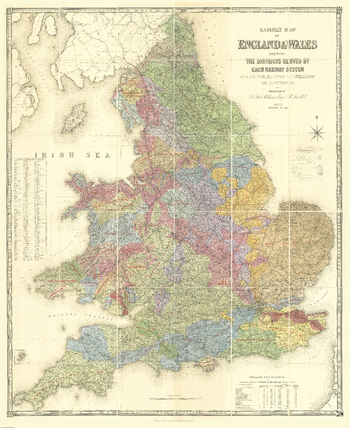
Stanford's Railway Map of England and Wales (1873/4)
The Stanford’s Railway Map of England and Wales is from a fascinating series of reproductions from our Edward Stanford Cartographic Collection archive.
Page Size: 71 x 86.75 in (1800 x 2201 mm)
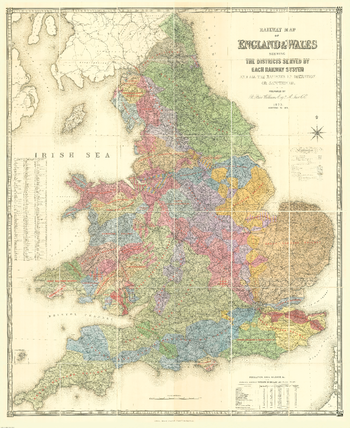
Stanford's Railway Map of England and Wales (1873/4) - Resized to 2A0 width
Resized so that the short side is equivalent to 2A0 short side. The Stanford’s Railway Map of England and Wales is from a fascinating series of reproductions from our Edward Stanford Cartographic Collection archive.
Page Size: 47 x 57.25 in (1189 x 1454 mm)
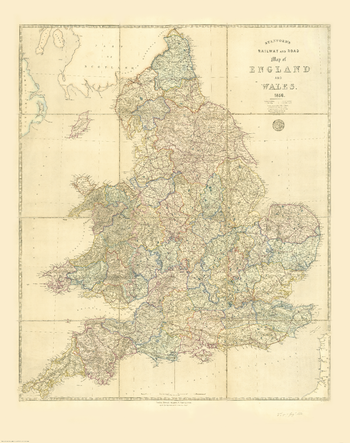
Stanford's Railway and Road Map of England and Wales (1856)
The Stanford’s Railway and Road Map of England and Wales is from a fascinating series of reproductions from our Edward Stanford Cartographic Collection archive.
Page Size: 34.5 x 43.5 in (870 x 1100 mm)
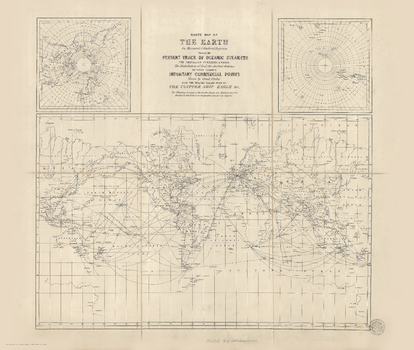
Stanford's Route Map of the Earth Black and White (1853)
The Stanford’s Route Map of the Earth in Black and White is from a fascinating series of reproductions from our Edward Stanford Cartographic Collection archive.
Page Size: 21.75 x 25.75 in (550 x 650 mm)
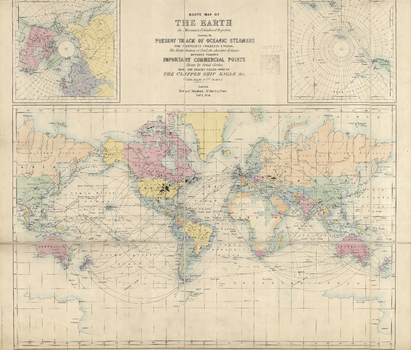
Stanford's Route Map of the Earth Colour (1854)
The Stanford’s New Map of the Earth of London is from a fascinating series of reproductions from our Edward Stanford Cartographic Collection archive.
Page Size: 22 x 25.75 in (553 x 650 mm)
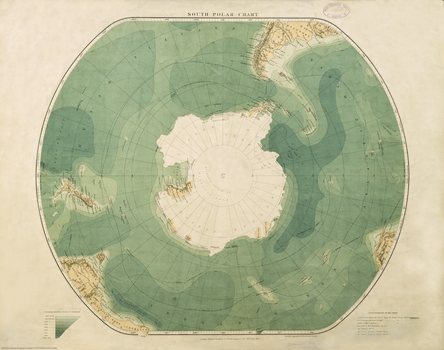
Stanford's South Polar Chart (1901)
The Stanford’s South Polar Chart is from a fascinating series of reproductions from our Edward Stanford Cartographic Collection archive. Published by E. Stanford. Ltd., London in 1901, this map displays beautiful aqua tones through the contours that show depth in fathoms from sea level. An interesting feature of this chart is that it shows routes of previous polar explorations. The tracks of the following three expeditions are given: The Challenger 1873-76 The German Expedition ‘Valdivia’ 1898-99 The Belgian Expedition ‘Belgia’ 1898-99 Other lines engraved on the chart are: The appropriate limit of the Pack Ice during the Austral Summer Months. Line of freezing point in the air. Northern limit of icebergs.
Page Size: 17.25 x 21.75 in (434 x 550 mm)
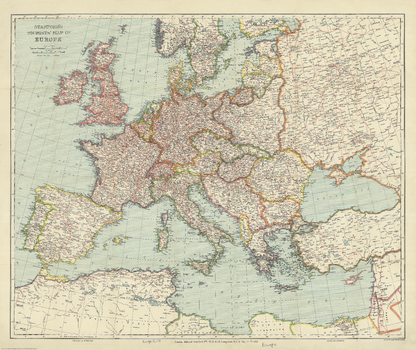
Stanford's Tourist's Map of Europe (1928)
The Stanford’s Tourist Map of Europe is from a fascinating series of reproductions from our Edward Stanford Cartographic Collection archive. Published by Stanford’s Geographical Establishment in May 1928, this map shows country borders in contrasting colours and the network on main and subsidiary railway lines. Coverage includes the southern coastline of the Mediterranean, extends to the eastern coast of the Black Sea, but in the north only the southern part of Scandinavia is included. The map shows Europe with its post-Versailles borders; British Isles have the same red border for both GB and the whole of Ireland, but acknowledging the existence of the “Irish Free State”. International borders along the southern and the eastern Mediterranean indicate colonial or mandated possessions. Within all the countries map shows main and subsidiary railway lines, displaying the great contrast between the extensive networks within Germany, most of England or northern France and the less densely covered eastern and south-eastern parts of Europe. Within Russia the railway linking St. Petersburg to Moscow with the kink (straightened in 2001) in the line known as the "Tsar's finger" catches one’s eye. Latitude and longitude lines are drawn at 2° intervals.
Page Size: 27 x 32 in (680 x 809 mm)
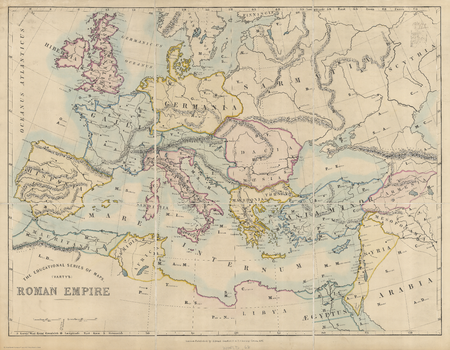
Stanford's Varty's Roman Empire Map (1879)
The Stanford's Varty's Roman Empire Map is from a fascinating series of reproductions from our Edward Stanford Cartographic Collection archive. This educational map of the Roman Empire was published by Edward Stanford in 1879. Featuring Latin place names, this is a beautifully simple historic map that will appeal to anyone with an interest in the history of the Roman Empire.
Page Size: 26 x 33.25 in (656 x 843 mm)
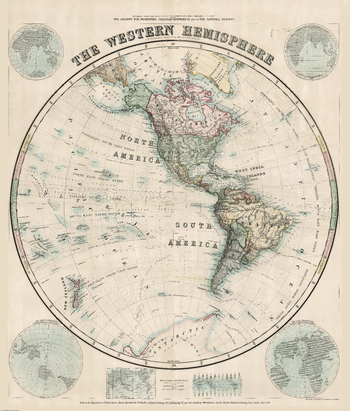
Stanford's Western Hemisphere Map (1877)
The Stanford’s Map of The Western Hemisphere is from a fascinating series of reproductions from our Edward Stanford Cartographic Collection archive. The original map from 1877 was drawn by Stanford’s Geographical Establishment and “published under the direction of the Committee of General Literature and Education Appointed by The Society for Promoting Christian Knowledge and of the National Society”. On this stereographic projection, individual countries are presented in gentle pastel hues typical of hand-coloured maps, with their borders outlined in stronger colours. The publication date of 1877 gives us the Americas more or less as we know it now but Antarctica with only a handful of coastal places named and believed to be flat. Hachures are used to show the mountain ranges and many other features of contemporary cartography are included: ocean currents and trade winds, surrounding frames showing the tropical zones and the position of the sun, etc. Latitude and longitude lines are drawn at 10° intervals. Additional panels on this map of the Western Hemisphere give examples of six different map projections, including Mercator’s projection and the gores of a globe complete on the same scale at the equator.
Page Size: 52.25 x 61.5 in (1326 x 1558 mm)
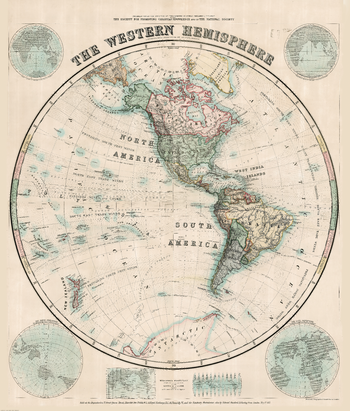
Stanford's Western Hemisphere Map (1877) - Resized to 2A0 width
Resized so that the short side is equivalent to 2A0 short side. The Stanford’s Map of The Western Hemisphere is from a fascinating series of reproductions from our Edward Stanford Cartographic Collection archive. The original map from 1877 was drawn by Stanford’s Geographical Establishment and “published under the direction of the Committee of General Literature and Education Appointed by The Society for Promoting Christian Knowledge and of the National Society”. On this stereographic projection, individual countries are presented in gentle pastel hues typical of hand-coloured maps, with their borders outlined in stronger colours. The publication date of 1877 gives us the Americas more or less as we know it now but Antarctica with only a handful of coastal places named and believed to be flat. Hachures are used to show the mountain ranges and many other features of contemporary cartography are included: ocean currents and trade winds, surrounding frames showing the tropical zones and the position of the sun, etc. Latitude and longitude lines are drawn at 10° intervals. Additional panels on this map of the Western Hemisphere give examples of six different map projections, including Mercator’s projection and the gores of a globe complete on the same scale at the equator.
Page Size: 47 x 55 in (1189 x 1397 mm)
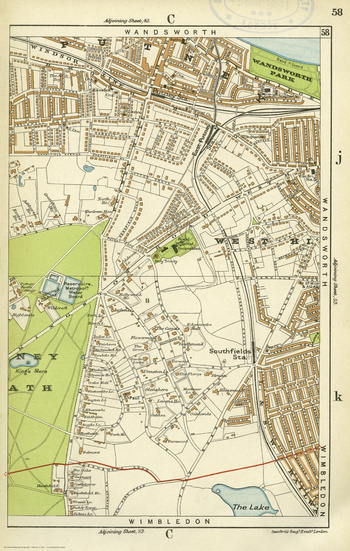
Stanford’s Indexed Atlas of the County of London, Sheet 58, Putney & Southfields (1911)
The Stanford’s Indexed Atlas of the County of London Shet 58 is from a fascinating series of reproductions from our Edward Stanford Cartographic Collection archive.
Page Size: 15.75 x 24.75 in (396 x 623 mm)